
Trend · Global energy
Is clean electricity keeping up with rising demand?
A common 12-month window across six major economies separates growth in clean power from growth in electricity demand.
July 2025–June 2026 versus July 2024–June 2025. Same scale for all six economies. Clean includes nuclear and renewables. Imports also affect demand; this comparison does not establish cause.
View chart data
| Economy | Demand | Clean generation | Fossil generation |
|---|---|---|---|
| United States | 99.4 | 133.1 | -11.5 |
| China | 533.7 | 445.4 | 91.1 |
| India | 93.3 | 93.9 | -0.7 |
| Germany | 5.3 | 19.2 | -1.6 |
| Japan | -4.6 | 12.6 | -17.2 |
| Australia | 4.6 | 11.6 | -7.0 |
Monthly data and calculations (JSON) ·
Source: FrugalWatt calculations from Ember Monthly Electricity Data, CC BY 4.0. Dataset and checksums.
Download the share chart (PNG)
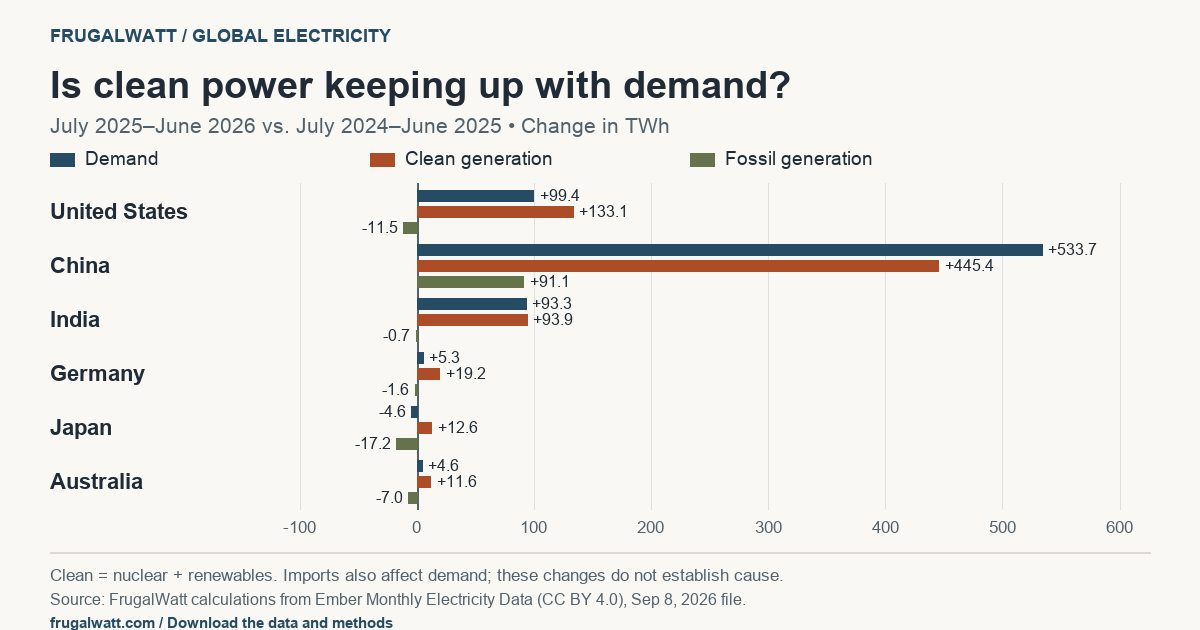
Demand rose in five of the six economies we compared. Clean generation grew by more than that increase in four: the United States, India, Germany and Australia. In China, clean generation rose 445.4 TWh while demand rose 533.7 TWh. Japan followed a different path: clean output increased while demand fell. These are changes in national totals, not an estimate of which plants served new demand.
Four economies where clean growth exceeded growing demand
We added up July 2025 through June 2026 and compared it with July 2024 through June 2025. Every economy in the main comparison uses these same 24 months. A terawatt-hour (TWh) is one billion kilowatt-hours.
In the United States, clean generation rose 133.1 TWh against a 99.4 TWh increase in demand. Wind and solar together contributed 100.9 TWh of the clean increase. Fossil generation fell 11.5 TWh.
India's clean increase was only slightly larger than its demand increase: 93.9 versus 93.3 TWh. Fossil generation fell 0.7 TWh. That is a narrow gap in this data release, so a future revision could change the comparison.
Germany and Australia also recorded more additional clean generation than additional demand. Their absolute changes were much smaller than China's or America's. The chart uses one shared scale so a large percentage increase in a smaller system does not look like a larger volume of electricity.
| Economy | Demand | Clean generation | Fossil generation |
|---|---|---|---|
| United States | +99.4 | +133.1 | −11.5 |
| China | +533.7 | +445.4 | +91.1 |
| India | +93.3 | +93.9 | −0.7 |
| Germany | +5.3 | +19.2 | −1.6 |
| Japan | −4.6 | +12.6 | −17.2 |
| Australia | +4.6 | +11.6 | −7.0 |
China added the most clean electricity in this comparison—and fossil output still rose
China's 445.4 TWh increase in clean generation was the largest of the six. It was equivalent to about 83.5% of the increase in demand. Fossil output nevertheless rose 91.1 TWh.
Both statements can be true: substantial clean growth can coincide with more fossil generation when total demand grows faster. The comparison does not identify why demand rose or separate the effects of weather, industrial activity, new equipment or policy.
Japan shows why the denominator matters
Japan's demand fell 4.6 TWh while clean generation rose 12.6 TWh. Fossil generation fell 17.2 TWh. Dividing clean growth by a negative demand change would produce a confusing percentage, so we do not report a growth-coverage ratio for Japan.
Imports explain why the columns do not simply cancel out
Generation and demand measure different things. Where Ember reports net imports, demand is domestic generation plus net imports. The US clean increase exceeded the demand increase by 33.7 TWh, but fossil generation fell by only 11.5 TWh. A 22.2 TWh decline in net imports accounts for the remaining difference, within source rounding.
The file does not publish net imports for Japan or Australia, and its demand series equals generation for those economies. That limitation should stay attached to comparisons across countries.
What “clean” means here
We use Ember's Clean aggregate: nuclear, hydro, wind, solar, bioenergy and other renewables. It is broader than wind and solar and is not a claim that every included technology has zero lifecycle emissions. This article measures electricity, not emissions. It does not reproduce or test an emissions headline.
A useful global signal, not a household bill forecast
Tracking demand alongside clean and fossil generation is a repeatable way to see whether the power mix is changing as electricity use grows. It cannot tell a household what next month's bill will be. Fuel prices, networks, tariffs, taxes and the timing of generation all sit between these national totals and a retail price.
For that question, use our US electricity price report. For a rooftop project, our four-city solar comparison shows why local production assumptions matter before calculating savings.
What this data does not tell you
- Six selected economies, not a world total. We selected large power markets with complete monthly data for the same window. This is not a complete or representative global sample.
- Different publication lags. Brazil is excluded from the main chart because its file coverage ends in April 2026. The downloadable research snapshot includes a separate, earlier comparison ending April; it is not mixed into these findings.
- Revisions and rounding. This article pins the file last modified September 8, 2026. Monthly observations can be revised; small differences, especially India’s, should not be treated as permanent thresholds.
- Accounting, not attribution. Annual changes do not identify the generation serving particular hours of load, explain the causes of demand growth, or establish avoided emissions.
Methodology and sources
FrugalWatt summed Ember monthly Demand, Clean, Fossil and Total generation in TWh for July 2025–June 2026 and July 2024–June 2025, then subtracted the earlier totals. Every required month is present; no missing observation was zero-filled or interpolated. We checked clean plus fossil against total generation, and generation plus net imports against demand where imports were published. Component-sum checks are unavailable when an economy lacks a component series. A separate calculation directly from the archived CSV reproduced all published totals and differences. Growth ratios are calculated only when demand rose. Values are rounded to one decimal for display. The source CSV and retrieval metadata are archived privately with SHA-256 checksums; the public snapshot contains the monthly series, calculations and source-file hash. Its research_not_published status describes the original research export; this article is the reviewed publication of the June comparison. Source data: Ember, Monthly Electricity Data, CC BY 4.0. Analysis and charts: FrugalWatt.
- Ember Monthly Electricity Data: source data and country coverage
- Ember electricity data methodology
- Ember monthly global CSV (a rolling source; our analysis pins the September 8 file)
- Data license: Creative Commons Attribution 4.0
Dataset version, source release and checksums
Dataset version ember-clean-vs-demand-740141929de5be8b · Source release CSV last modified September 8, 2026 · Retrieved September 17, 2026. Download the snapshot manifest and file checksums. The observation or model period is separate from the release date and retrieval date. How we verify.
More analysis
Related tools
Drafted with AI assistance from FrugalWatt's data pipeline. Figures use the cited Ember Monthly Electricity Data snapshot; No interviews were conducted and no professional review is claimed. Editorial policy · Subscribe via RSS.