What the same 6-kW solar system produces in four Texas and Nevada cities
Before comparing solar quotes, separate how much electricity a system can generate from what your utility will pay for it.
By Evin Anderson · Published September 17, 2026
Model basis Modeled typical year · Source: PVWatts V8
The same 6-kW solar system, four different seasons
Modeled typical-year production, not measured 2026 output. Same 6-kW DC, south-facing roof at 20° tilt, 14% system losses; no battery. Runs retrieved September 17, 2026.
DallasHoustonLas VegasReno
View chart data
The same 6-kW solar system, four different seasons — Modeled AC electricity, kWh per month
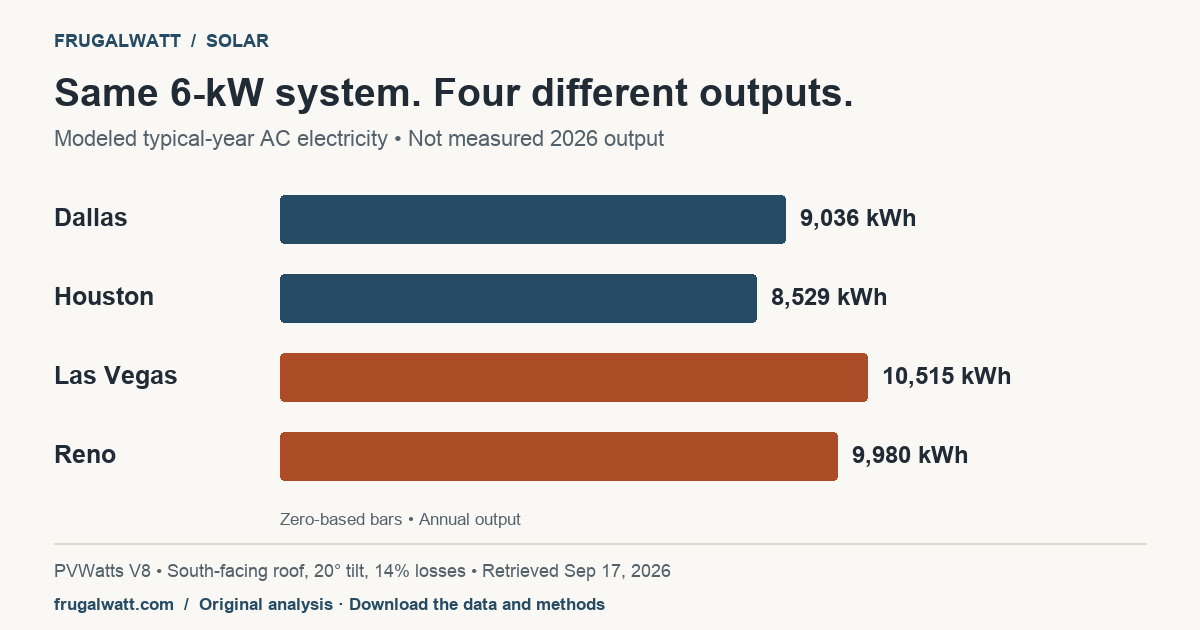
Using the same roof assumptions, a 6-kW system produces an estimated 8,529 kWh a year in Houston and 10,515 kWh in Las Vegas—a 23% difference. Dallas and Reno fall between them. These are typical-weather model results, not measured household output or a savings forecast.
Same system, different output
We held the equipment and roof settings constant: 6 kW of DC panel capacity, standard modules, fixed roof mounting, south-facing at a 20-degree tilt, and 14% system losses. Only the city coordinates changed. The figures below are AC electricity, after the model accounts for conversion to usable power.
Modeled typical-year output; identical reference systems
City
kWh per year
kWh per kW DC
Dallas
9,036
1,506
Houston
8,529
1,421
Las Vegas
10,515
1,753
Reno
9,980
1,663
Las Vegas comes out 23% above Houston. Dallas is 6% above Houston, while Reno is 10% above Dallas. This is a comparison of four modeled locations, not a ranking of every roof or a statewide average.
The annual total hides the seasonal pattern
In these model runs, Dallas and Houston peak in July, Las Vegas in May, and Reno in June. Reno generates about 1,071 kWh in June versus 524 in January. An annual total alone cannot tell you how much solar electricity you will have in the month you need it.
These patterns combine the weather resource and PVWatts' performance model. This comparison does not isolate the separate effects of sunshine, temperature or cloud cover. A hotter city does not automatically have the highest modeled output.
More electricity is not the same as more savings
The next question is when your home uses the electricity. A kilowatt-hour used directly at home and one exported to the grid may have different values. Your import price, export-credit rules, fixed charges and household demand determine the bill effect.
For example, 9,000 kWh of annual solar production is not automatically 9,000 kWh of avoided purchases. Some production may leave the house while you are away; later, the house may buy electricity back. We have not assigned either flow a dollar value here.
The solar payback calculator lets you examine cost and savings assumptions separately. Use the tariff and quote for your own home; the city figures above do not establish an export rate or an installed price.
Three questions to ask about a solar quote
What annual AC output does the quote predict? Compare its system size and output per installed kW with a location-specific model, then check differences in roof angle, orientation and shading.
What happens month by month? Ask for monthly production and compare it with your monthly use. A full bill analysis also needs the timing of imports and exports.
Which electricity-plan rules are assumed? Ask for the actual import charges, export credit, fixed fees and eligibility conditions. A production estimate cannot establish those rules.
What this data does not tell you
Your roof. These are reference systems at city coordinates. Actual roof geometry, shading, equipment and losses can change output.
A particular year. Typical meteorological year weather is assembled to represent typical conditions. These figures are not observations from 2026, a next-year forecast or a confidence interval.
Your savings. No household load, battery operation, installed cost, financing, utility tariff or tax-credit assumption is included. The results establish neither payback nor a recommended installer.
Methodology and sources
FrugalWatt queried PVWatts V8 for Dallas (32.78, −96.80), Houston (29.76, −95.37), Las Vegas (36.17, −115.14) and Reno (39.53, −119.81). All runs use model 8.5.0, NSRDB PSM V3 GOES tmy-2020 3.2.0 weather, 6-kW DC capacity, standard modules, fixed roof mounting, 20° tilt, 180° azimuth, 14% losses, 1.2 DC/AC ratio, 96% inverter efficiency and 0.4 ground-coverage ratio. The assumed inverter capacity is 5 kW AC (6 kW DC divided by 1.2). The export retains each selected weather station, time zone, coordinates and inputs. Annual and monthly AC kWh were checked against the archived raw API responses and the sum of 8,760 hourly AC-watt observations divided by 1,000. Article values are rounded only for display; comparisons use unrounded values.
Dataset version pvwatts-four-cities-7f9a771621f8d544 · Source release Model 8.5.0; NSRDB PSM V3 GOES tmy-2020 3.2.0 weather · Retrieved September 17, 2026. Download the snapshot manifest and file checksums. The observation or model period is separate from the release date and retrieval date. How we verify.
Drafted with AI assistance from FrugalWatt's data pipeline. Figures use the cited PVWatts V8 snapshot; No interviews were conducted and no professional review is claimed. Editorial policy · Subscribe via RSS.