
Trend · Electricity bills
Texas’s power boom is mostly happening outside the home
Texas accounted for 43% of a decade’s net growth in U.S. electricity sales. Commercial and industrial customers explain four-fifths of the state’s increase. That should sharpen the debate over who pays for expansion.
Texas’s electricity sales grew 32.5% between 2015 and 2025. Four-fifths of the increase went to commercial and industrial customers. Over the same decade, the average residential account bought about 5% less power per month.
Put those findings together and a question becomes hard to avoid: when a growing electricity system needs investment, how much of the cost should land on households?
“Electricity use is growing” is an incomplete explanation for asking households to pay more. We need to know whose use is growing, what infrastructure it requires, and who benefits from it. These figures help identify the customers involved; they do not determine a fair division of costs on their own.
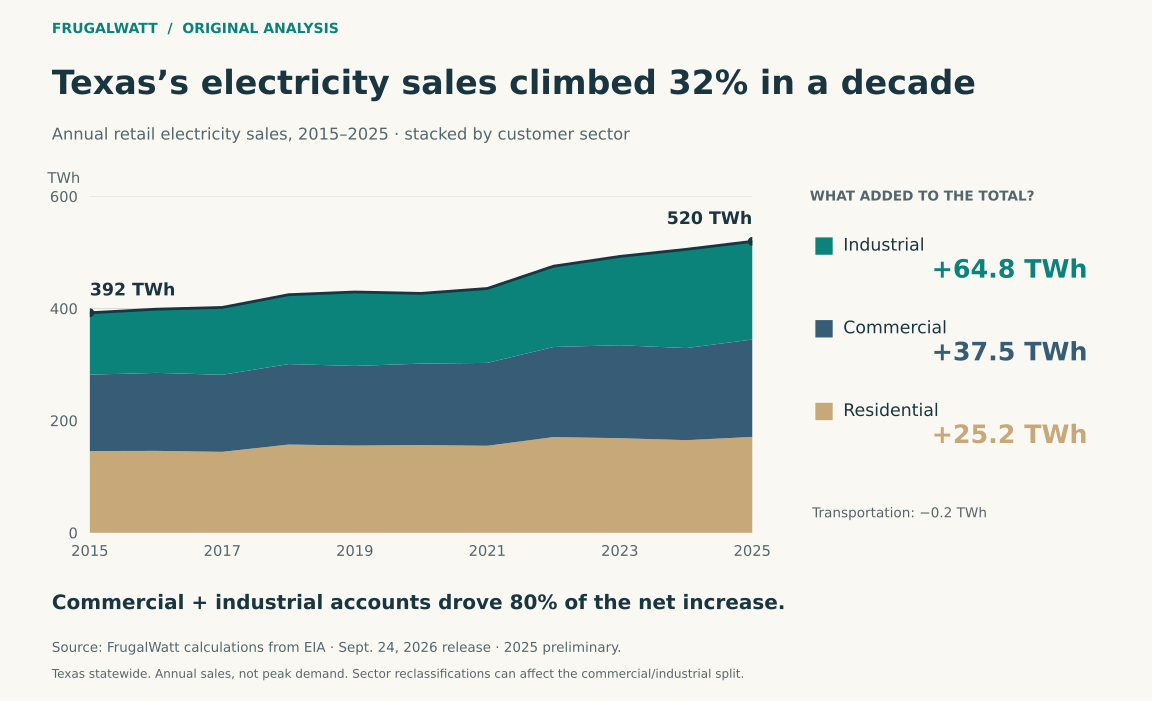
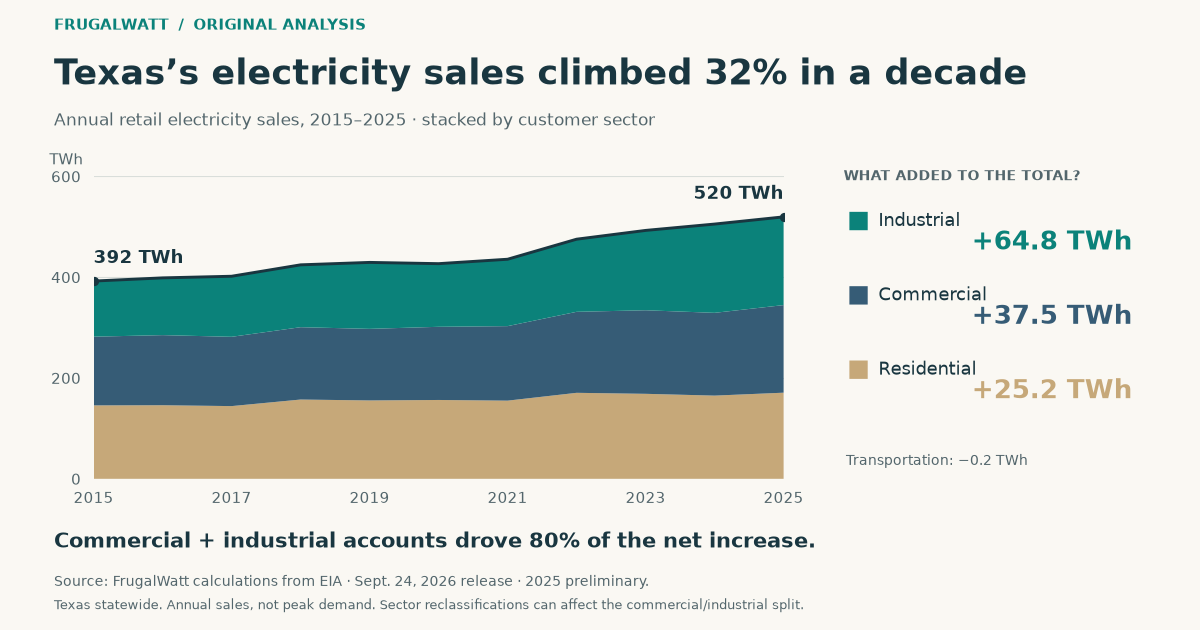
Annual retail electricity sales, 2015–2025, stacked by customer sector. Texas statewide; 2025 preliminary. The top line is the total, not an individual sector.
Changes since 2015. Transportation is included in the total and fell 0.2 TWh. Commercial and industrial accounts together contributed 80% of the net increase.
View chart data
| Year | Residential | Commercial | Industrial | Transportation | Total |
|---|---|---|---|---|---|
| 2015 | 145.7 | 136.3 | 110.2 | 0.2 | 392.3 |
| 2016 | 146.0 | 139.1 | 113.4 | 0.2 | 398.7 |
| 2017 | 144.2 | 137.5 | 120.0 | 0.2 | 401.9 |
| 2018 | 157.3 | 143.5 | 123.5 | 0.2 | 424.5 |
| 2019 | 155.5 | 142.0 | 131.7 | 0.2 | 429.3 |
| 2020 | 156.4 | 145.2 | 125.1 | 0.2 | 426.9 |
| 2021 | 155.1 | 147.8 | 132.5 | 0.2 | 435.6 |
| 2022 | 170.6 | 160.7 | 143.9 | 0.2 | 475.4 |
| 2023 | 168.6 | 165.8 | 158.2 | 0.2 | 492.8 |
| 2024 | 165.1 | 164.2 | 176.1 | 0.0 | 505.4 |
| 2025 | 170.9 | 173.8 | 175.0 | 0.0 | 519.7 |
Download the share chart (PNG) · Download SVG · Annual sector data (JSON)
Source: EIA, September 24, 2026 release. Annual sales, not peak demand. Sector reclassifications can affect the commercial/industrial split. Chart source and checksums.
One state accounted for an extraordinary share of the increase
FrugalWatt calculated changes in full-year retail electricity sales using the U.S. Energy Information Administration’s state sales, revenue and customer data, preserved from its September 24, 2026 release.
Between 2015 and 2025, annual U.S. retail sales increased by 299.0 terawatt-hours. Texas accounted for 127.4 TWh, or 42.6% of the national net increase. A terawatt-hour is one billion kilowatt-hours.
Texas was already a large electricity market, but its contribution to growth exceeded its size. It accounted for 12.8% of U.S. retail electricity sales in 2025. Across the decade, sales grew 32.5% in Texas, compared with 5.1% across the rest of the country combined.
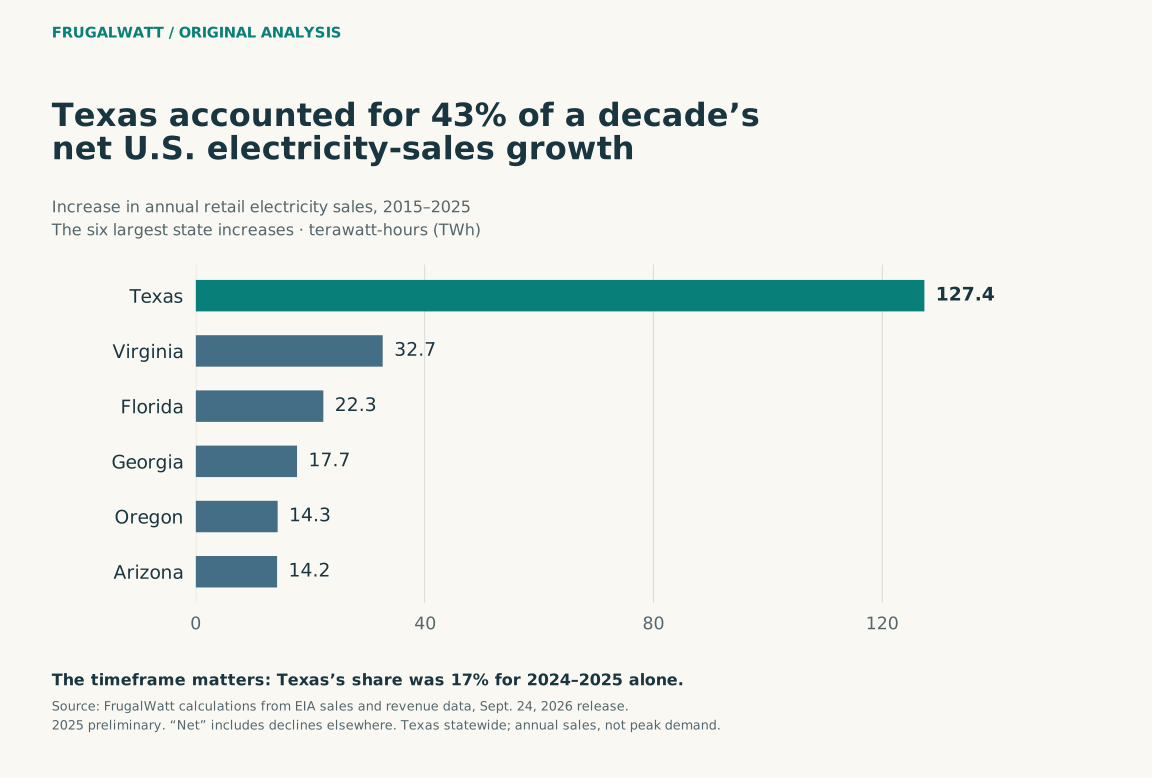
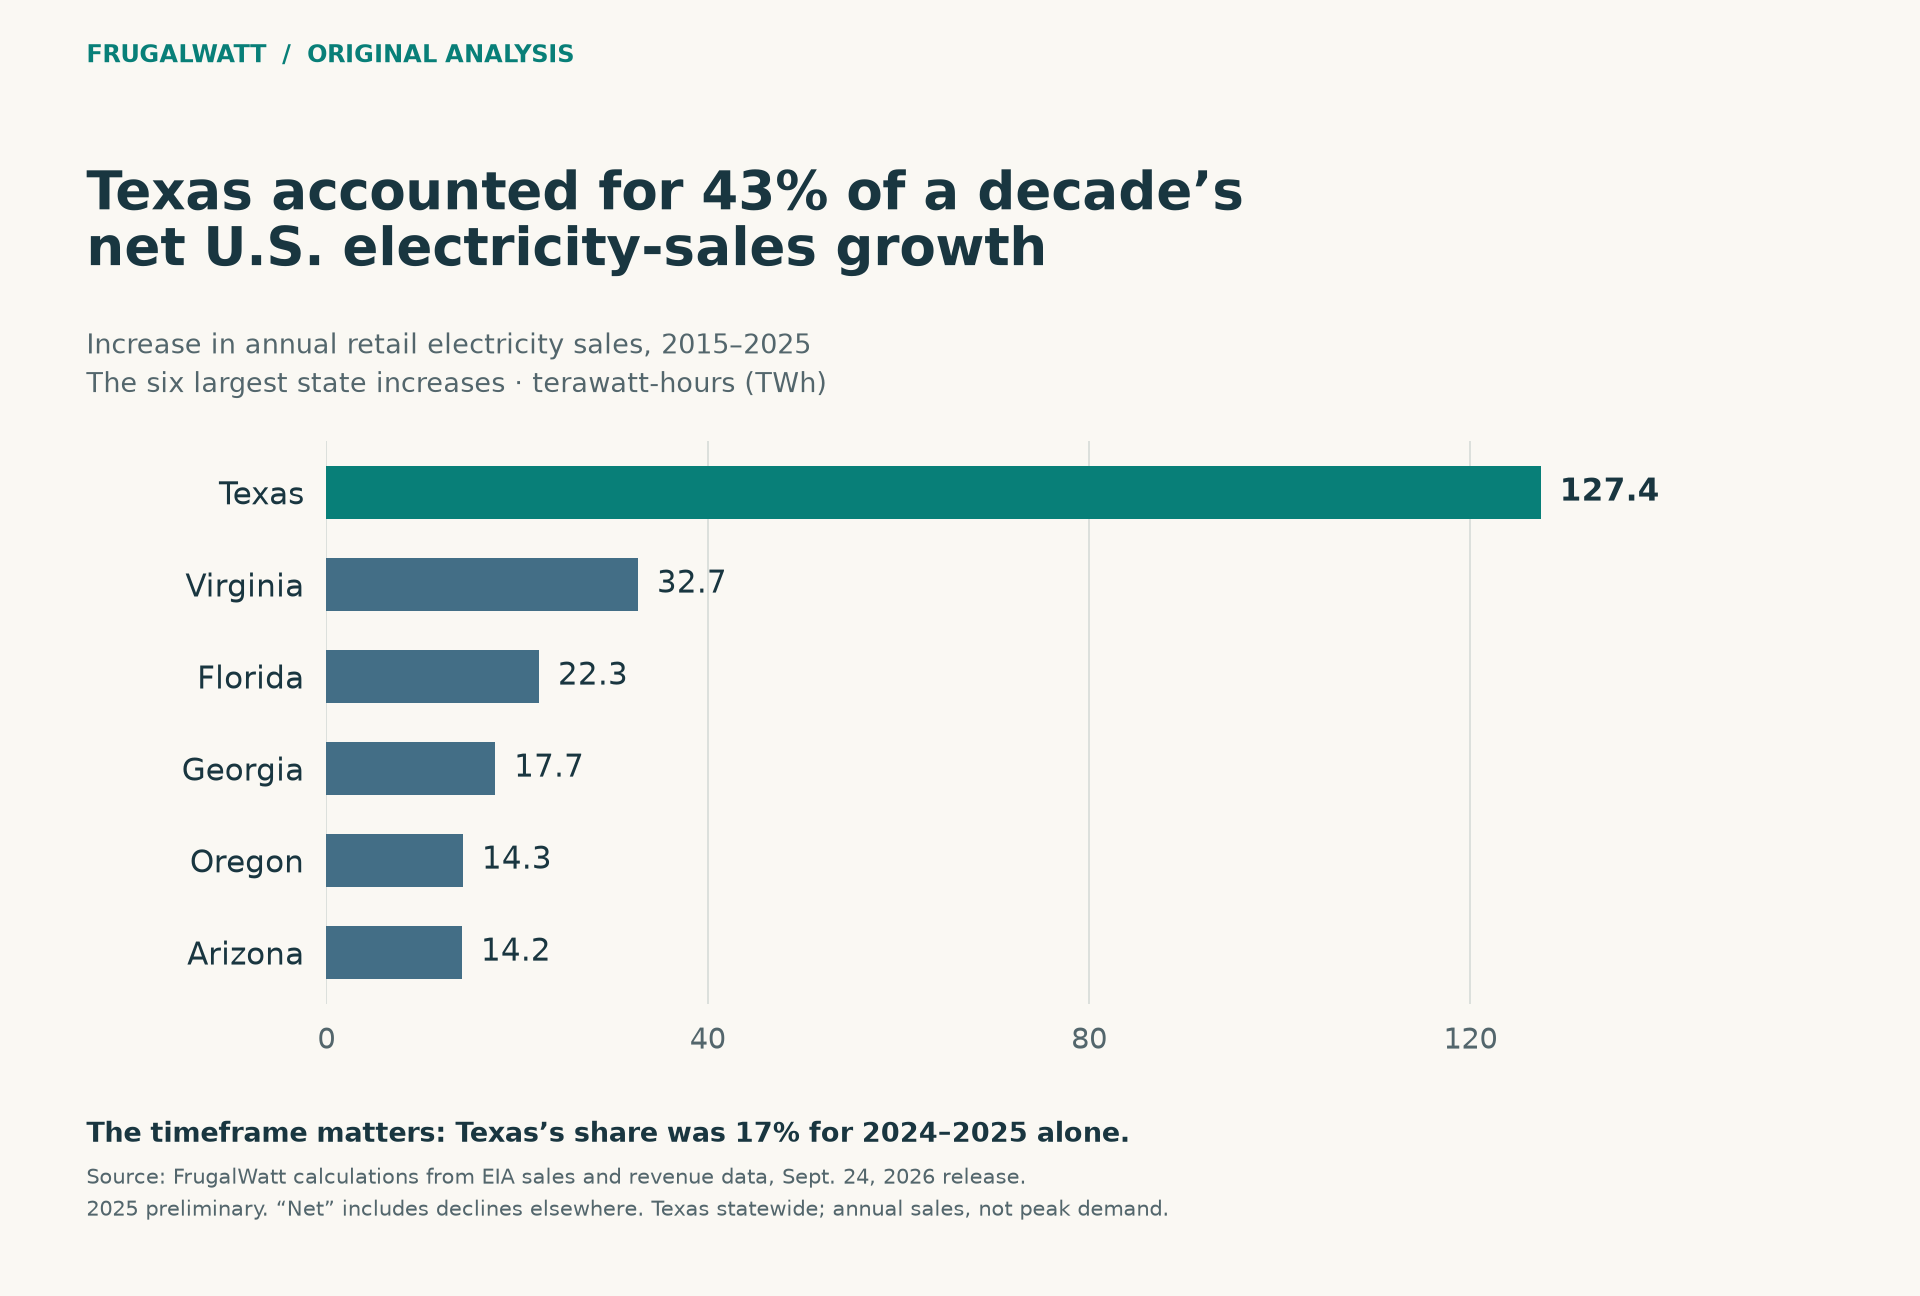
Six largest state increases, 2015–2025. Texas’s share was 17.3% for 2024–2025 alone. 2025 preliminary; full-state annual retail sales, not peak demand.
View chart data
| State | 2015–2025 change |
|---|---|
| Texas | 127.4 |
| Virginia | 32.7 |
| Florida | 22.3 |
| Georgia | 17.7 |
| Oregon | 14.3 |
| Arizona | 14.2 |
“Net increase” matters. Sales fell in some states, offsetting growth elsewhere. If we count only states where sales increased, Texas contributed 36.2% of that combined increase. Either calculation shows substantial concentration; they answer different questions.
The timeframe matters just as much. Texas accounted for 17.3% of the national increase between 2024 and 2025, well below its share over the full decade. Recent growth was less concentrated in Texas. The 43% figure describes a ten-year change, not Texas’s current annual contribution.
| Comparison | Texas increase (TWh) | U.S. net increase (TWh) | Texas share |
|---|---|---|---|
| 2015–2025 | 127.4 | 299.0 | 42.6% |
| 2019–2025 | 90.4 | 246.9 | 36.6% |
| 2024–2025 | 14.3 | 82.6 | 17.3% |
Four-fifths of the Texas increase came from commercial and industrial accounts
Commercial and industrial customers together added 102.3 TWh, accounting for 80.3% of Texas’s net increase between 2015 and 2025. Residential sales rose by 25.2 TWh.
The annual series also shows when the growth occurred: about 66% of the decade’s net increase came between 2021 and 2025. The chart separates the rising total from the customer sectors buying the electricity.
| Texas customer sector | 2015 sales (TWh) | 2025 sales (TWh) | Change (TWh) |
|---|---|---|---|
| Industrial | 110.2 | 175.0 | +64.8 |
| Commercial | 136.3 | 173.8 | +37.5 |
| Residential | 145.7 | 170.9 | +25.2 |
| Transportation | 0.2 | 0.0 | −0.2 |
| Total | 392.3 | 519.7 | +127.4 |
Values are rounded; the small transportation decline is included in the net total. Source: FrugalWatt calculations from EIA.
This is a reason to examine business and institutional demand closely. It is not a measurement of how much electricity artificial intelligence uses.
EIA’s commercial category includes much more than data centers: shops, offices, schools and other institutions also sit within it. Industrial demand is another broad category. Customers can also be reclassified between the commercial and industrial sectors; combining them makes the central finding less sensitive to those shifts. EIA’s technical notes explain that classification issue.
To assign a specific share to AI, manufacturing or another activity, we would need more detailed evidence. The defensible finding here is substantial growth outside the residential sector.
More residential accounts, lower purchases per account
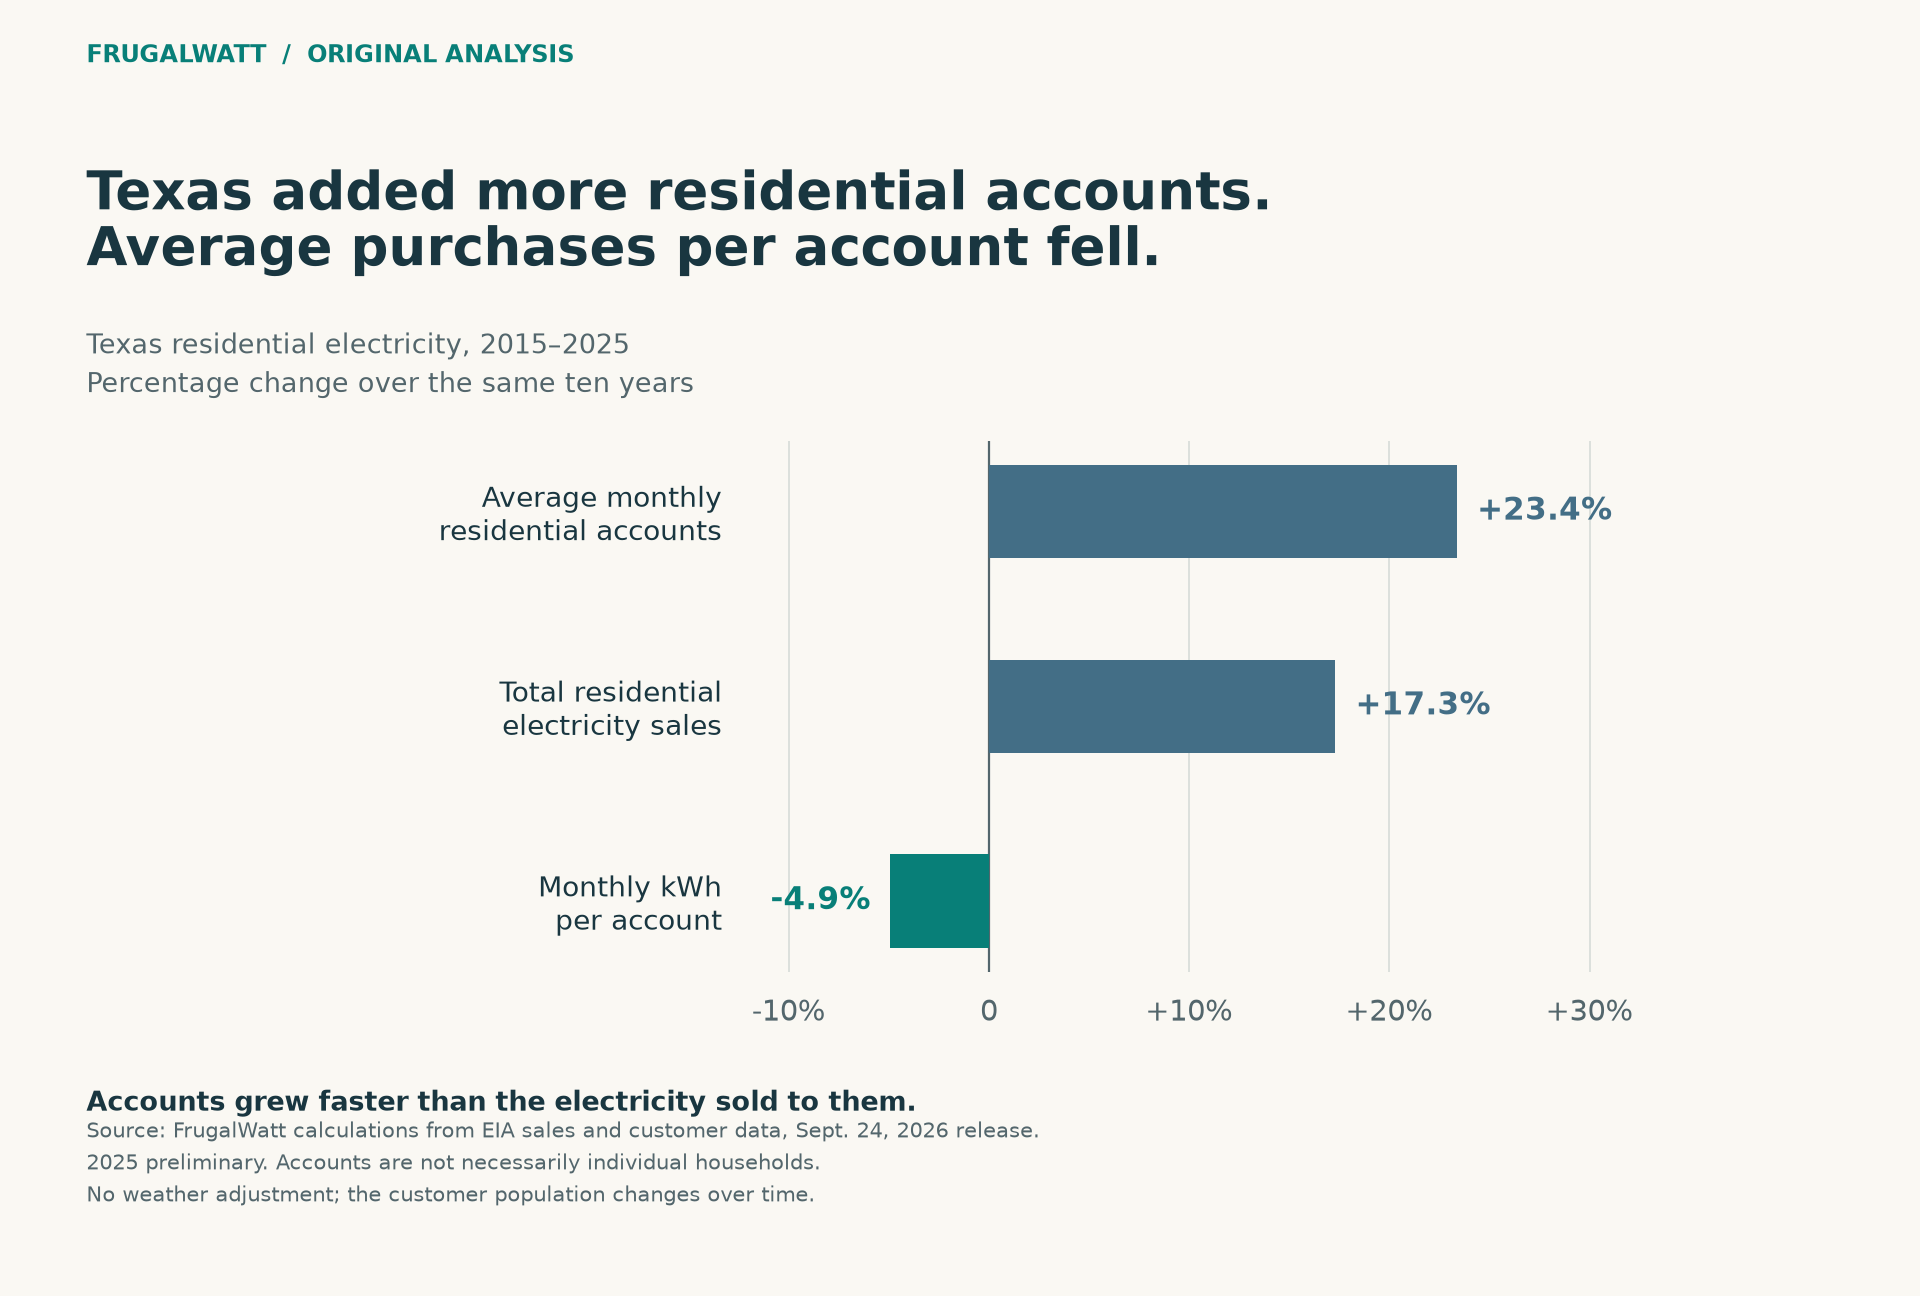
Texas’s residential sales increased even though average purchases per account fell. The arithmetic is straightforward: the number of accounts grew faster than the electricity sold to them.
Between 2015 and 2025, the average monthly number of residential accounts rose 23.4%, while residential electricity sales rose 17.3%. Average monthly purchases per account fell from about 1,176 to 1,118 kWh.
That does not tell us that the same household became more efficient. These are statewide averages across a changing customer base. Weather, building types, occupancy and electricity generated and used onsite can affect the comparison. EIA’s customer counts generally represent meters or accounts, which do not always correspond one-to-one with households. EIA’s retail sales methodology describes those distinctions.
Still, the result is consequential: Texas’s residential growth cannot be described simply as each existing customer buying more electricity.
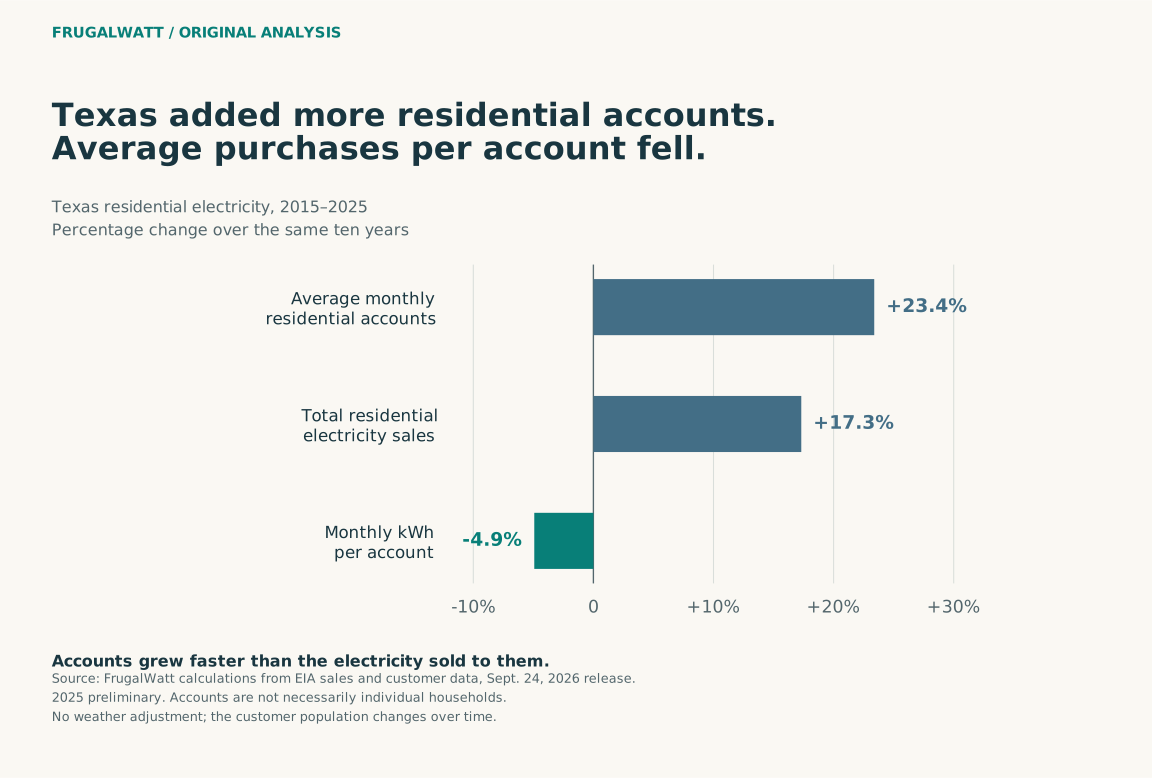
Texas residential sector, 2015–2025. 2025 preliminary. Accounts are not necessarily individual households. No weather adjustment; customer composition changes.
View chart data
| Measure | Percentage change |
|---|---|
| Accounts | 23.4 |
| Total sales | 17.3 |
| kWh/account | -4.9 |
The money moved in the other direction. Dividing residential revenue by customer-account months gives an average monthly bill of approximately $136 in 2015 and $173 in 2025. That is a 27.2% increase in nominal dollars.
The inflation check changes the interpretation. Overall U.S. consumer prices rose 35.8% over the same period, based on BLS’s annual CPI-U averages. Adjusted using that benchmark, Texas’s average monthly residential bill fell 6.4%. The higher dollar bill did not outpace general inflation.
Neither measure settles affordability for an individual household, which also depends on income and circumstances. Nor can these aggregates tell us how much of a bill came from fuel, networks, financing or retail charges. The data support scrutiny of future cost allocation; they do not establish that the past decade’s power boom left households financially worse off.
Growth needs a cost plan as well as a power plan
FrugalWatt’s view is that proposals to expand the electricity system should identify the customers creating the need, the benefits shared with existing users, and the risks if expected demand does not materialize.
A large new customer could help spread existing fixed costs over more electricity sales. It could also require expensive additions built specifically to serve it. The balance depends on location, timing, contracts and the infrastructure involved. Rising annual sales alone cannot settle that balance.
That is why the share of electricity growth is not the share of infrastructure costs a customer class necessarily ought to pay. Annual energy totals do not reveal who drives the busiest hour on a local network, or which project relieves a shared constraint.
The right response is to make those costs and benefits visible. For a proposed expansion, regulators and customers should be able to see:
- Which demand is backed by a firm commitment, and which remains a forecast?
- Which investments are needed for particular new customers, and which benefit the wider system?
- Who bears the unrecovered cost if a major customer cancels, arrives late or uses less power than expected?
Households should not become the default backstop for someone else’s growth forecast. Shared benefits can justify shared costs. That case should be demonstrated rather than assumed.
For homeowners, the practical implication is also personal: compare your own billed kWh, fixed charges and effective price over equivalent periods. A national growth headline cannot explain your individual bill. Our state electricity-price analysis provides context, while your bill supplies the detail that matters for decisions at home.
What this data does not tell you
- Geography and measurement. Coverage is the 50 states and Washington, DC. Texas means the entire state, not ERCOT. Annual retail sales are not peak demand or all electricity consumption; power generated and consumed directly onsite is outside this measure.
- Timeframe. Texas’s 43% share describes the 2015–2025 national net increase, including declines elsewhere. Its share for 2024–2025 alone was 17.3%. No partial-year 2026 data enter the calculations. 2025 is preliminary.
- Customer composition. No weather adjustment was made. Accounts are not necessarily individual households, and this comparison does not track the same households over time. Combining commercial and industrial figures reduces sensitivity to reclassifications between those sectors.
- Causation and affordability. These figures do not establish a causal link between business growth and household bills, quantify data-center demand or demonstrate a household subsidy. Nominal and CPI-adjusted bills are both reported; neither measures affordability without information about income and circumstances.
- Other questions. This analysis does not estimate emissions or recommend a generation technology. Those questions require additional evidence.
Methodology and sources
Complete calendar years are compared using a frozen EIA workbook. Monthly sales and revenue are summed; average monthly purchases and bills divide annual kWh or dollars by the sum of monthly residential account counts. Texas’s contribution divides its change by the U.S. change over the same period. The inflation comparison uses BLS’s published U.S. annual CPI-U averages, not a Texas-specific index. Charts, tables and narrative figures render from the saved calculation output. An independent workbook pass reconciled the annual totals against the pinned warehouse release.
- EIA Form EIA-861M: monthly sales, revenue and customer data
- Archived EIA historical workbook used in this analysis (XLSX)
- Electric Power Monthly: September 24, 2026 release
- BLS: annual CPI-U averages, U.S. city average (2015 and 2025)
- Checked BLS source excerpt (JSON)
- EIA technical notes: sector classification and revenue definitions
- EIA retail sales methodology: accounts, weather and sector definitions
- EIA: electricity sales and direct use
- FrugalWatt calculations and sensitivity checks (JSON)
- Annual EIA aggregates underlying the calculations (JSON)
Dataset version, source release and checksums
Dataset version texas-electricity-growth-9a97a61ce34b6c70 · Source release September 24, 2026; BLS CPI-U annual averages checked October 3, 2026 · Retrieved October 3, 2026. Download the snapshot manifest and file checksums. The observation or model period is separate from the release date and retrieval date. How we verify.
More analysis
Related tools
Drafted with AI assistance from FrugalWatt's data pipeline. Figures use the cited EIA retail electricity data snapshot; No interviews were conducted and no professional review is claimed. Editorial policy · Subscribe via RSS.